Viewing the Barman Server details on a PEM dashboard v8
Once the Barman server is configured, you can see the entire backup- and server-related details for that particular Barman server on the PEM Dashboard.

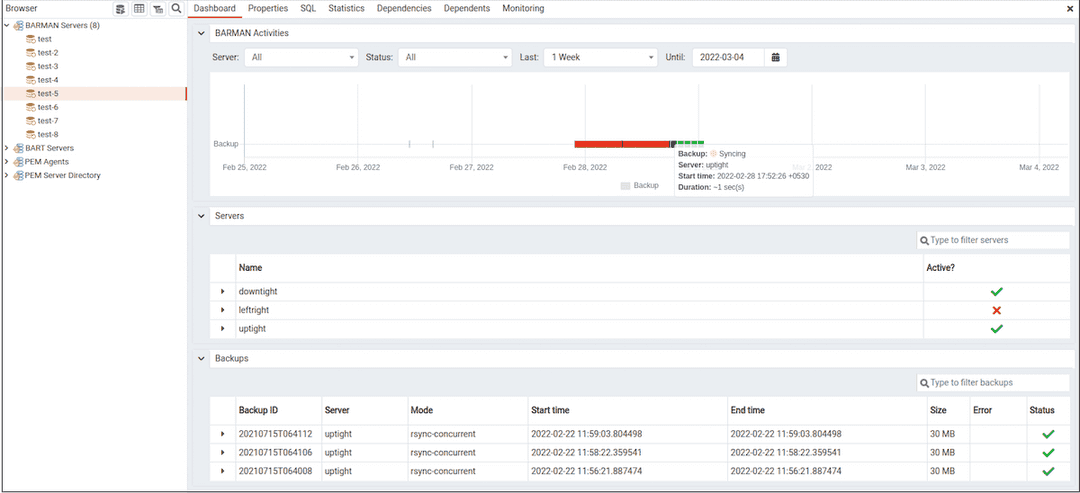
When you select a monitored Barman server, details of all the associated database servers along with their activities are displayed as a chart on the Dashboard in the Barman Activities panel. You can select the activities on any criteria that you specify in the filter boxes (the database server, status, duration, or date).
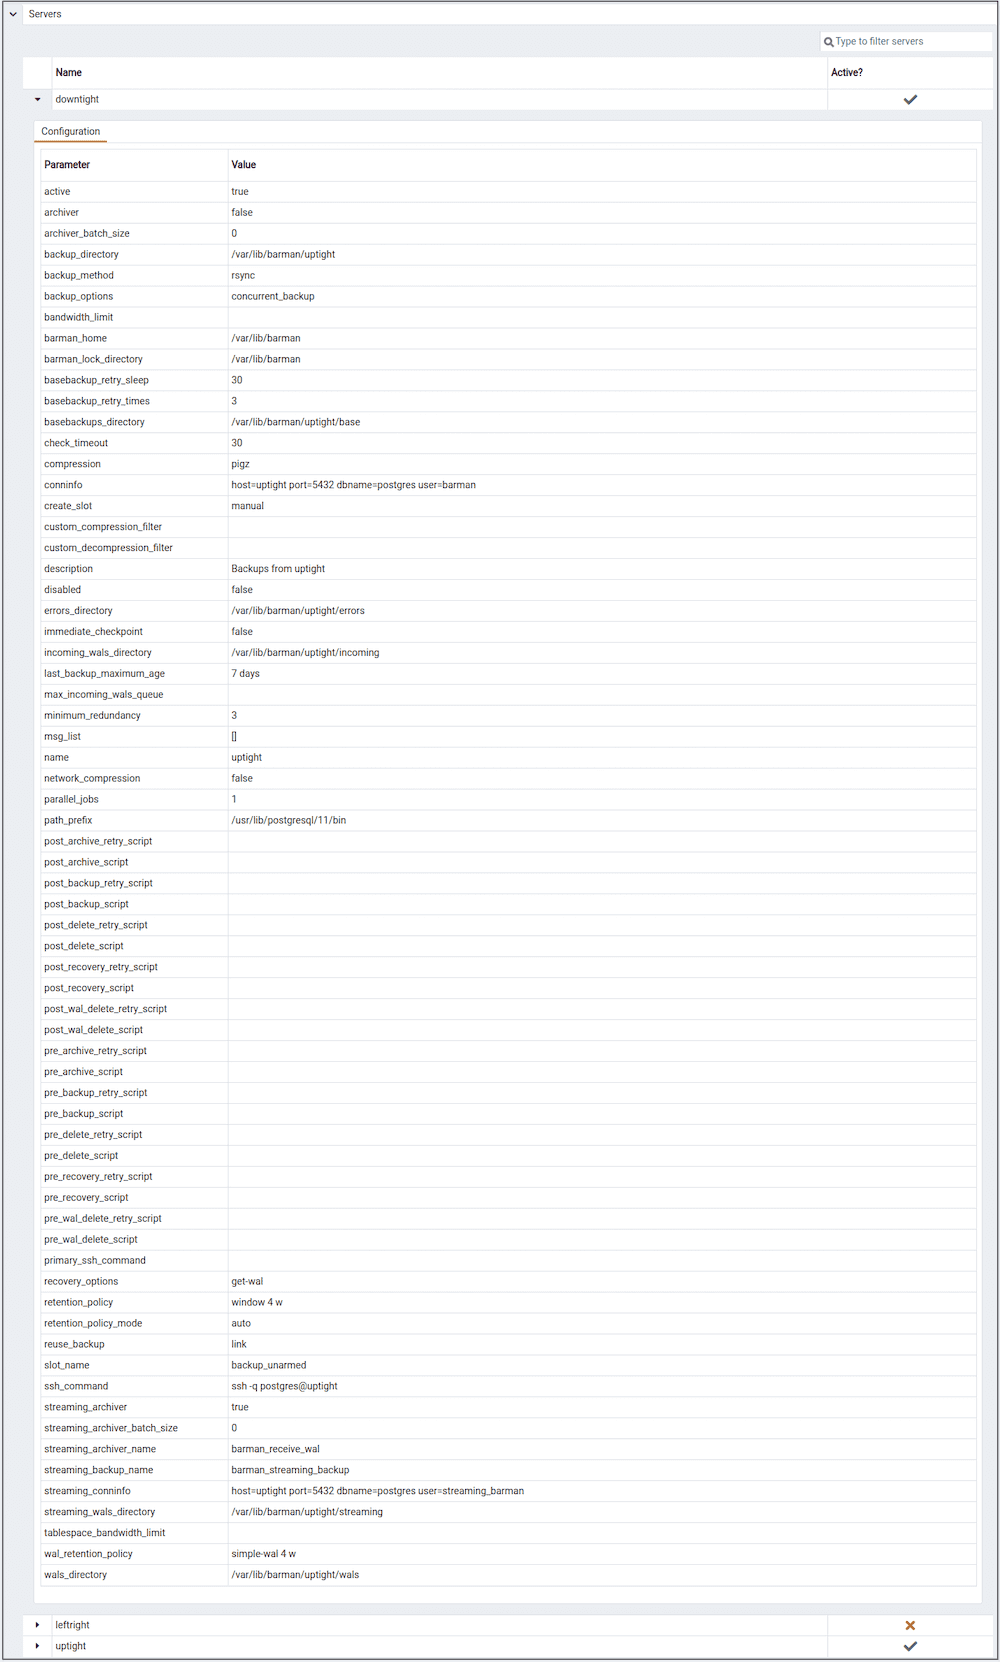
The Servers panel displays a list of all the database servers managed by that particular Barman server along with the active status.

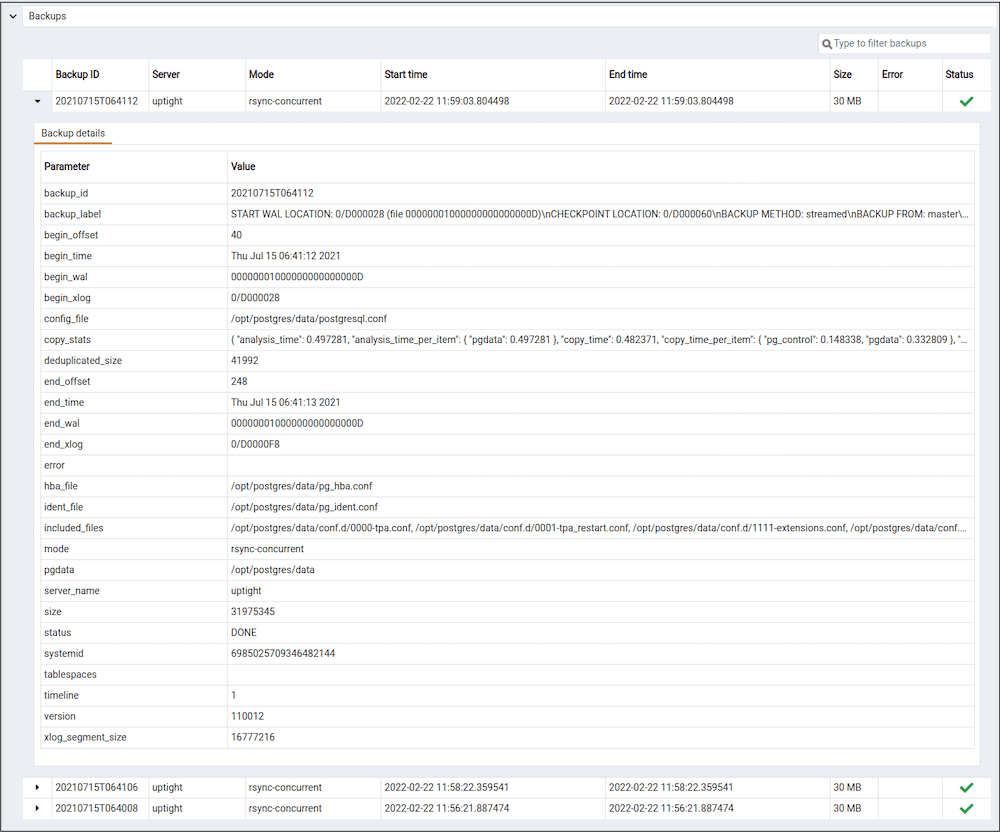
The Backups panel displays a list of all the backups of the database servers managed by that particular Barman server. You can filter the list to display the details of a particular database server. You can also filter the list on any criteria that you specify in the filter box. Typically, this filter works with any kind of string value (excluding date, time, and size) listed under the columns. For example, you can type tar to filter the list and display only those backups that are in tar format.
Backup details includes the Backup ID, Server, Mode, Start time, End time, Size, Error, and Status column.
